There is a speed limit to a human’s light detection abilities. If something happens faster than approximately 60 Hz, our brains will tie those episodes together and treat them as one long event. This phenomenon is used ubiquitously by the motion picture industry to create the perception of movement from still frames of action. Minor changes from frame to frame enable our eyes and brain to fill in the blanks and create a moving image.
That’s one reason it is very difficult for the human eye to detect the output of a flashlamp and benchmark it properly unaided. Using our library of tools, PulseForge users can increase their perception rate from 60 Hz all the way up to 1 MHz, or more than 16,000 times faster. Detecting flashes quickly opens up a world of parameters to benchmark the light output. I’ll discuss them in some detail throughout this write-up.
Without reliable benchmarking of the pulsed light output, the only way to control it is by measuring the input to the tool. This method, however, fails to capture the uniformity of exposure, electricity to light efficiency, and, critically, the shape of the pulse. These factors play an essential role in determining the success of processing and are key factors in designing the appropriate pulse structure. By precisely characterizing the light output by a tool, we can rationally design processes for a variety of applications, support design by interdisciplinary teams of users, and allow for reliable reproducibility of desired flash conditions on other similar PulseForge systems.
Here is an outline of how PulseForge considers benchmarking a pulse of light. It is critical to holistically consider the output parameters of a system when evaluating a tool for your application. If done correctly, these measurements enable standardization of a condition so that it can be recreated on different PulseForge systems worldwide.
Shape of the pulse
It may be counterintuitive to consider a light pulse to have a shape. A light is either on or off, after all, and it has some brightness. What more could there be to consider?
When we consider the shape of the pulse, we’re talking about the temporal shape of light output over the pulse duration. For example, how fast does the pulse turn on, how long is it in the “on” position, and how fast is the light output extinguished? All these factors play an essential role in determining how much energy is transferred.
While there are quite a few different factors that determine the functionality of a pulse, nothing is as important as the shape of the pulse in our view. Modern flashlamp technology (underpinning the PulseForge tools) is designed to deliver the fastest possible turn-on time, the most stable “on” regime, and quite a rapid turn-off time.
The ”eye” watching the flashes in every PulseForge tool is a photodiode. This semiconductor light sensor can detect light intensity very quickly – every microsecond. Every time your eyes become aware of a flash of light, the photodiode has already seen more than 1600 flashes of light. What looks like a flash of light that barely happened to you has a rich history of brightness over time that the photodiode has recorded.
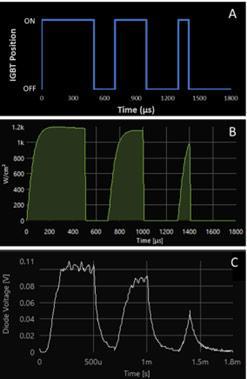
All PulseForge tools come standard with a photodiode readout of each pulse that can be translated to the shape of the pulse. This readout is critical to understanding how the pulse shape changes in response to a change in voltage, duration, or frequency of power delivered to the lamp. Figure 1, shows a standard photodiode output. The photodiode is slightly more sensitive to blue light because the sensing mechanism is absorption by the semiconductor bandgap material, but it remains a crucial tool to understand the pulse shape because of its high sampling frequency and robust durability.

Figure 1: representation of pulse shape for a complex pulse structure. (A) the IGBT switch turns on the current to the flash lamp. (B) calculated response of the flash lamp to the input current. (C) the measured photodiode output corresponding to the achieved pulse shape.
The relationship between the flow of current and light output is illuminating, and it’s important to understand the shape of the pulse to optimize the outcome of the processing. The PulseForge tools are equipped with a script to calibrate the photodiode, allowing the photodiode output to be displayed as a power output measurement. This enables quick and easy readout of the output as the processing is happening.
Radiant exposure per pulse
Our second benchmark of a pulse is how much energy (in form of radiant exposure) was illuminated onto the sample. To this end, a bolometer is used to measure the radiant output per pulse. The PulseForge bolometer is a NIST traceable sensor that is designed to pick up sharp pulses of energy between 0.2 and 60 J/cm2.

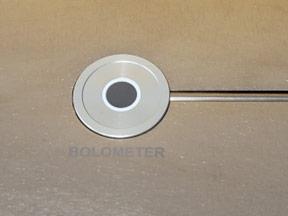
Figure 2: Bolometer sensor stationed on a PulseForge Invent sample stage.
The bolometer is a very precise tool with simple construction. Its very dark center is an efficient broadband absorber with a very precisely known area, mass, and thermal heat transfer coefficient. When light shines on it, the temperature goes up quickly, which is picked up as a temperature change by the bolometer. Imbedded software converts the temperature into radiant exposure. Rather than functioning as the “eye” of the tool, the bolometer is a mechanical analog to your skin, which feels the heat energy of the sun when it shines down. It can safely, efficiently, and precisely absorb the light energy from the flash as heat, and report its warmth back.
A second route to evaluate radiant exposure is to integrate the output from the photodiode, discussed earlier, over the pulse length. This method is slightly less accurate, but is commonly used with production-level PulseForge tools as an “on the line” tracking tool to ensure no significant deviation in the pulse energy over time without any extra equipment needed.
Peak power output
A third benchmark of a single pulse is the peak power output during the pulse. This value is especially key for processes whose main purpose involves significant thermal gradients. The peak power describes the fastest rate at which the lamp delivers its energy over time. However, as we know, the shape of the pulse is not uniform. As such, there are multiple ways to arrive at peak power. The methods outlined below aim to capture that value in different ways.
Average method
In this, the simplest way to measure the peak power output, the bolometer measurement is divided by the expected pulse length. This method works best for square pulses with minimal change over the pulse length but fails when considering pulse conditions that combine micropulses or are dominated by the rise and fall time of the pulse.
Running average method
For this method, multiple bolometer measurements are needed. The pulse can be divided up into smaller sections. Then we measure the pulse output for each section. The ratio of differences in measured bolometer values and pulse lengths gives us the peak power within the evaluated interval. For two sections with output energies E1 and E2 delivered over pulse durations t1 and t2, the peak power Pmax can be calculated by:
Pmax=(E2-E1)/(t2-t1)
This method works well for a wide range of pulse types and outputs. The evaluation, however, is limited by the number of pulse conditions that can be measured using the bolometer. If the pulse condition of interest lies at limits of the range of possible conditions for a tool, for example, this method will be challenging to employ.
Photodiode integration method
This benchmark method uses a combination of the bolometer and the photodiode measurement for a pulse to estimate the peak power output. The integral of the photodiode output will be equal to the measurement of the bolometer. The objective is to convert the voltage output of the photodiode to a measurable peak power output. The native software used to calibrate the photodiode is based on this method. The integration method is most useful for pulses that contain micro-pulses of energy and when a range of peak outputs over the full pulse structure is delivered. This type of measurement, however, can be biased in the photodiode measurements due to the higher sensitivity to blue light discussed before.
Average power delivery
Moving beyond a single pulse of energy, the bolometer can be used to evaluate average power when the pulsing sequence is rapid enough to allow only minimal cooling of the bolometer between pulses. This is typical for pulse frequency greater than 10 Hz. This type of measurement can be done in both the average or the running average methods outlined in the peak power calculations. The key here is to avoid exposure to higher than 60 J/cm2 pulse trains, which will start to degrade the bolometer sensor.
Average power is a dominant parameter for very long pulse processes, and especially relevant to the burgeoning PulseForge soldering application.
Creating with the PulseForge
Using only a few simple but sophisticated tools, it’s possible to get a precise view of how the PulseForge lamp output varies over time. Precise knowledge of pulse shape, peak power, and average power is critical to use of flash lamps, especially a PulseForge tool. These are the factors we consider most heavily when designing a pulse for a particular process, which will in turn determine what tools will be appropriate for an application. Now that you’ve had a peek into the methods we use to design these cutting-edge machines, what beautiful and important things will you build with one?

Written by the PulseForge Applications Team
Contact Us
Please contact us at PulseForge to discuss your technical questions and production needs — we look forward to hearing from you.
pf.sales@pulseforge.com
+1 (512) 491-9500


